Seed-Strapping: The Founder's Playbook for Scaling Without Surrendering Control
Learn how seed strapping can fuel your startup's growth. Discover practical strategies and insights to navigate this crucial funding stage. Read more!



You don’t grow by accident. You grow by design.
The Product–Market Matrix is your design language. Use it right and you’ll stop guessing where to place bets, when to harvest, and what to kill. Use it incorrectly, and you’ll continue to burn cash on “pet projects” while your competitors make money.
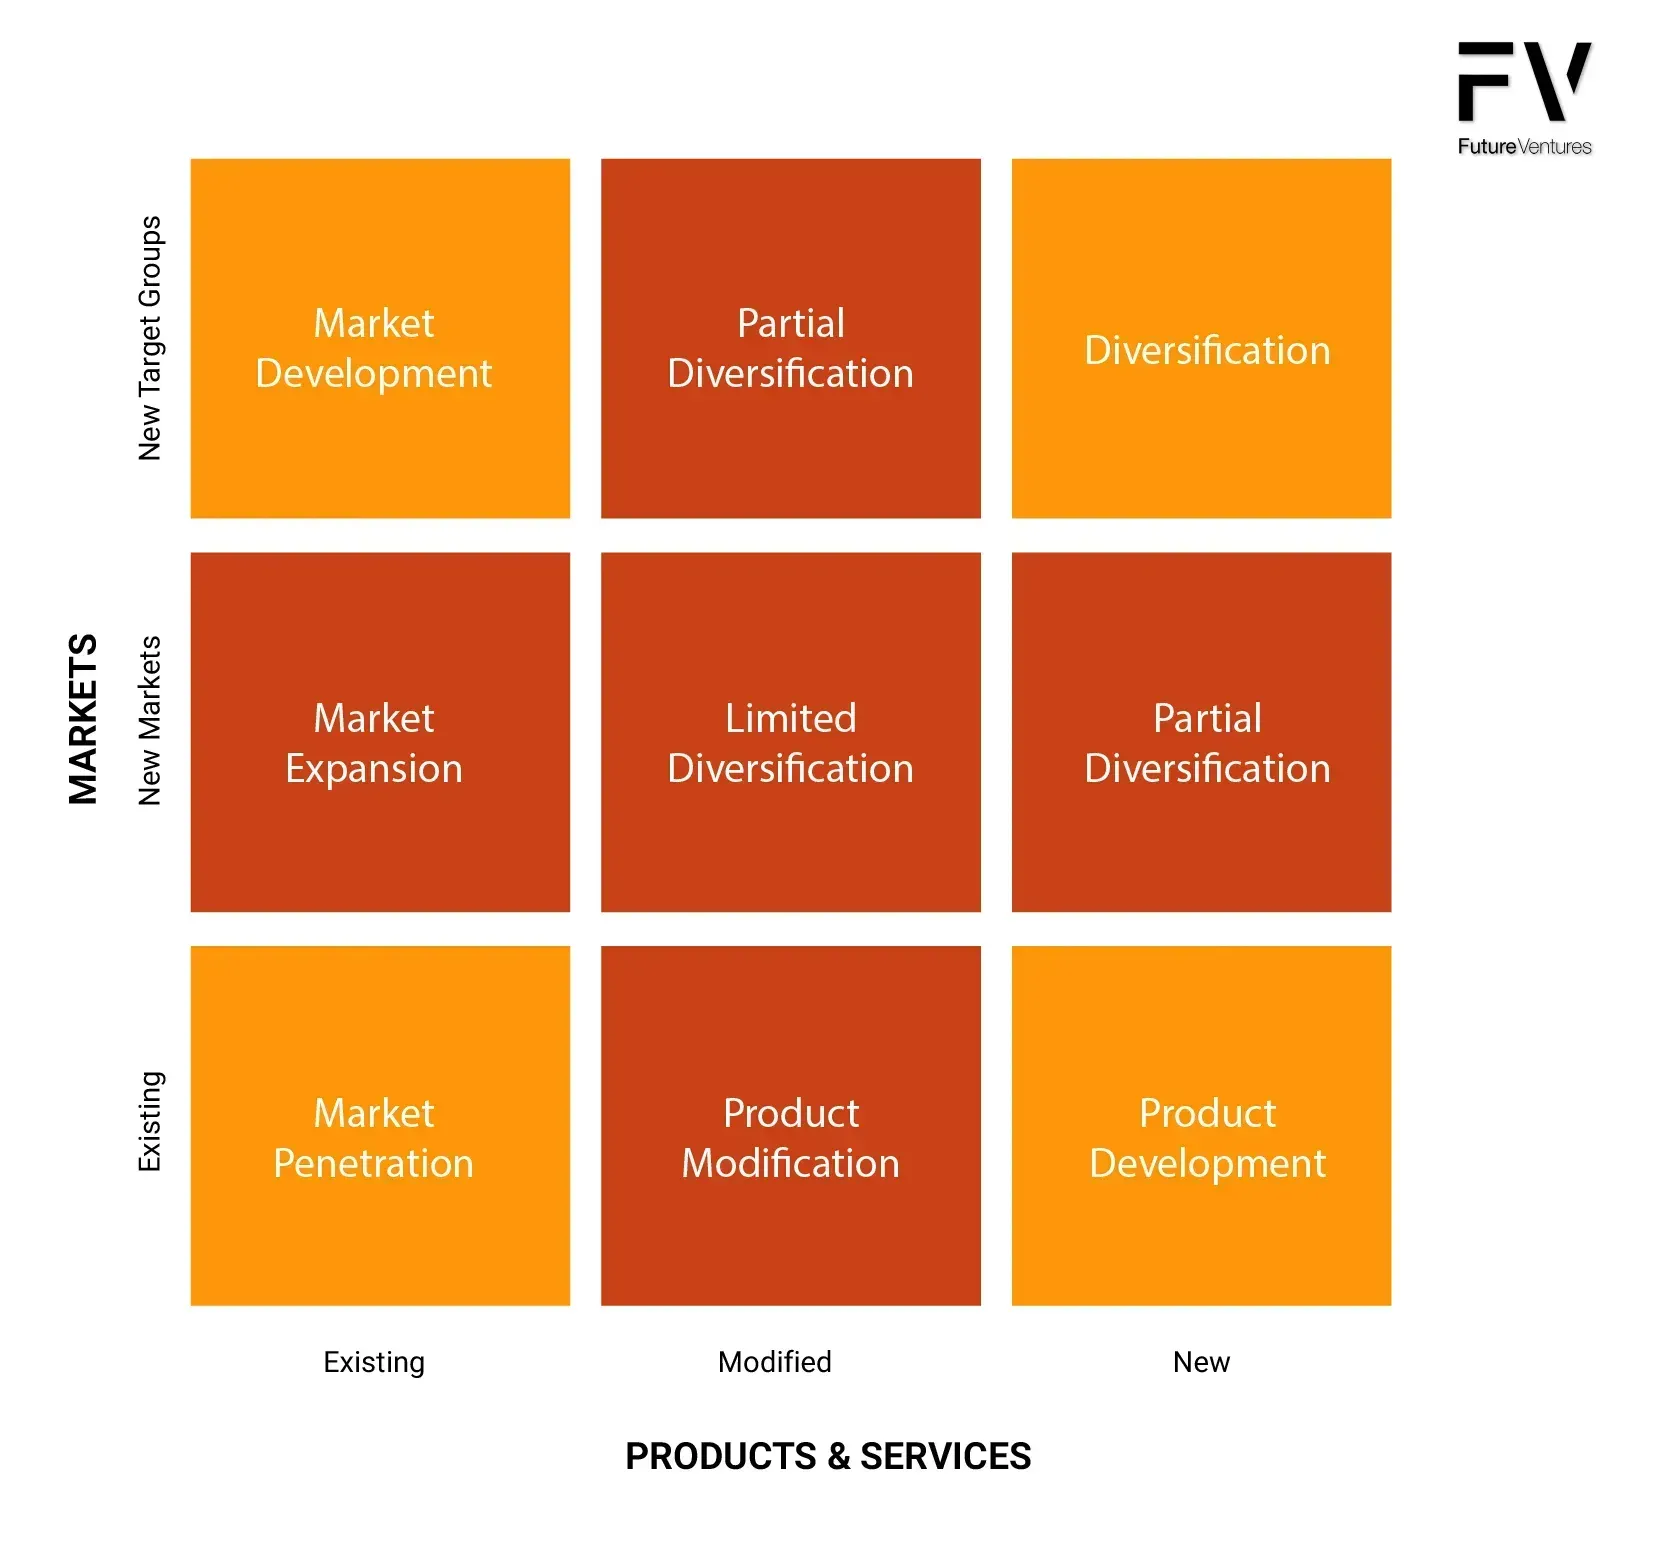
This guide provides a concise, founder-friendly system for selecting growth plays, allocating resources, and testing focus, utilizing the Ansoff Matrix (first published in the Harvard Business Review in 1957) and the BCG Growth–Share Matrix (which determines where to place your chips). You’ll also get working definitions for every “matrix” people throw around at meetings, plus practical templates you can use this quarter.
A Business manager utilizes frameworks like the Product-Market Matrix to guide company growth and assess risks.
Purpose: decide how you’ll grow - by penetrating, developing, building, or diversifying. When using the Ansoff Matrix, it is crucial to evaluate risks associated with each growth strategy and develop contingency plans to address potential challenges.
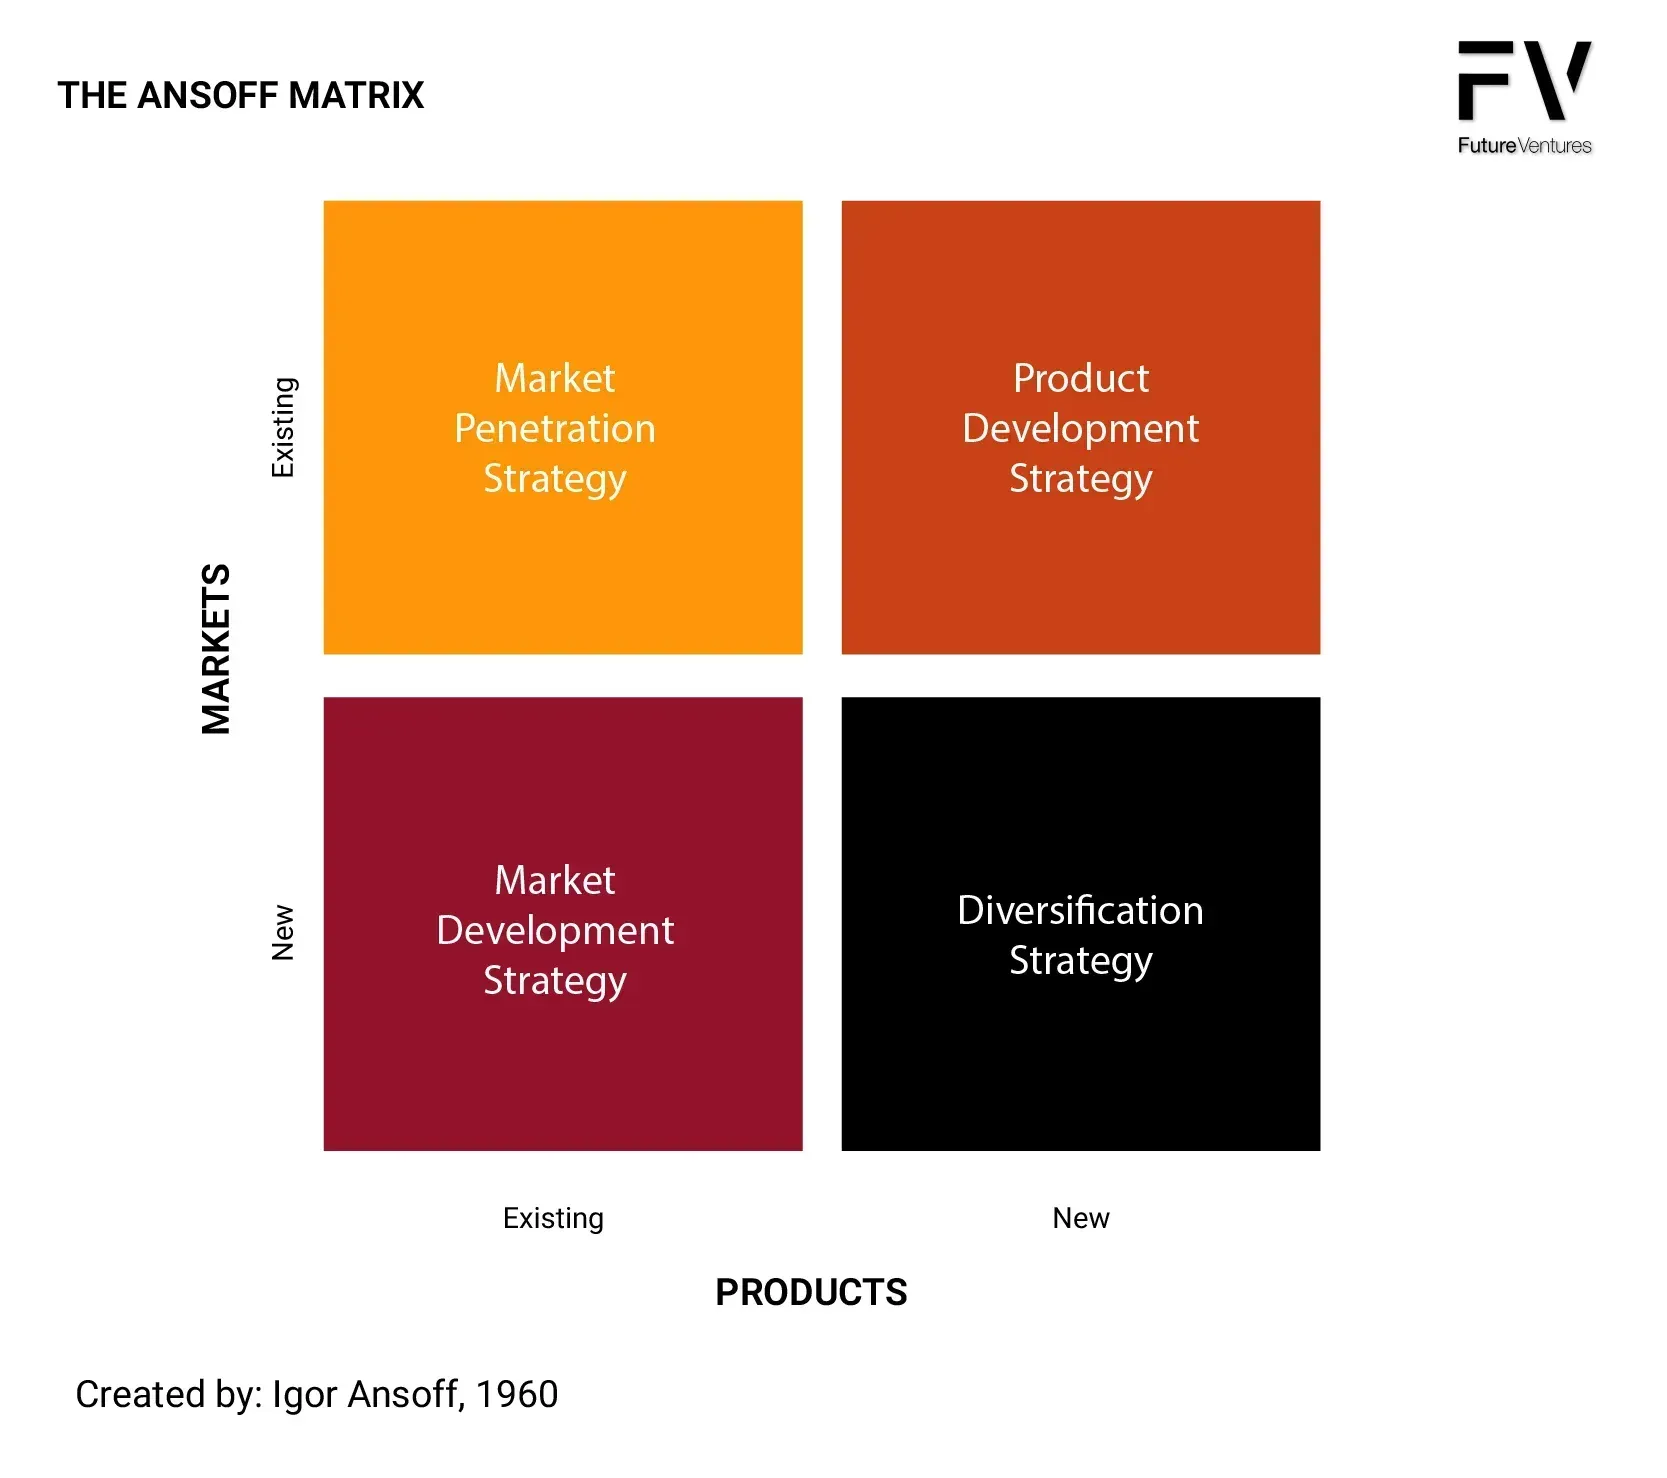
1.Market Penetration (Existing Product × Existing Market)
2.Product Development (New Product × Existing Market)
3.Diversification (New Product × New Market)
Purpose: decide where to put money this year across your portfolio.
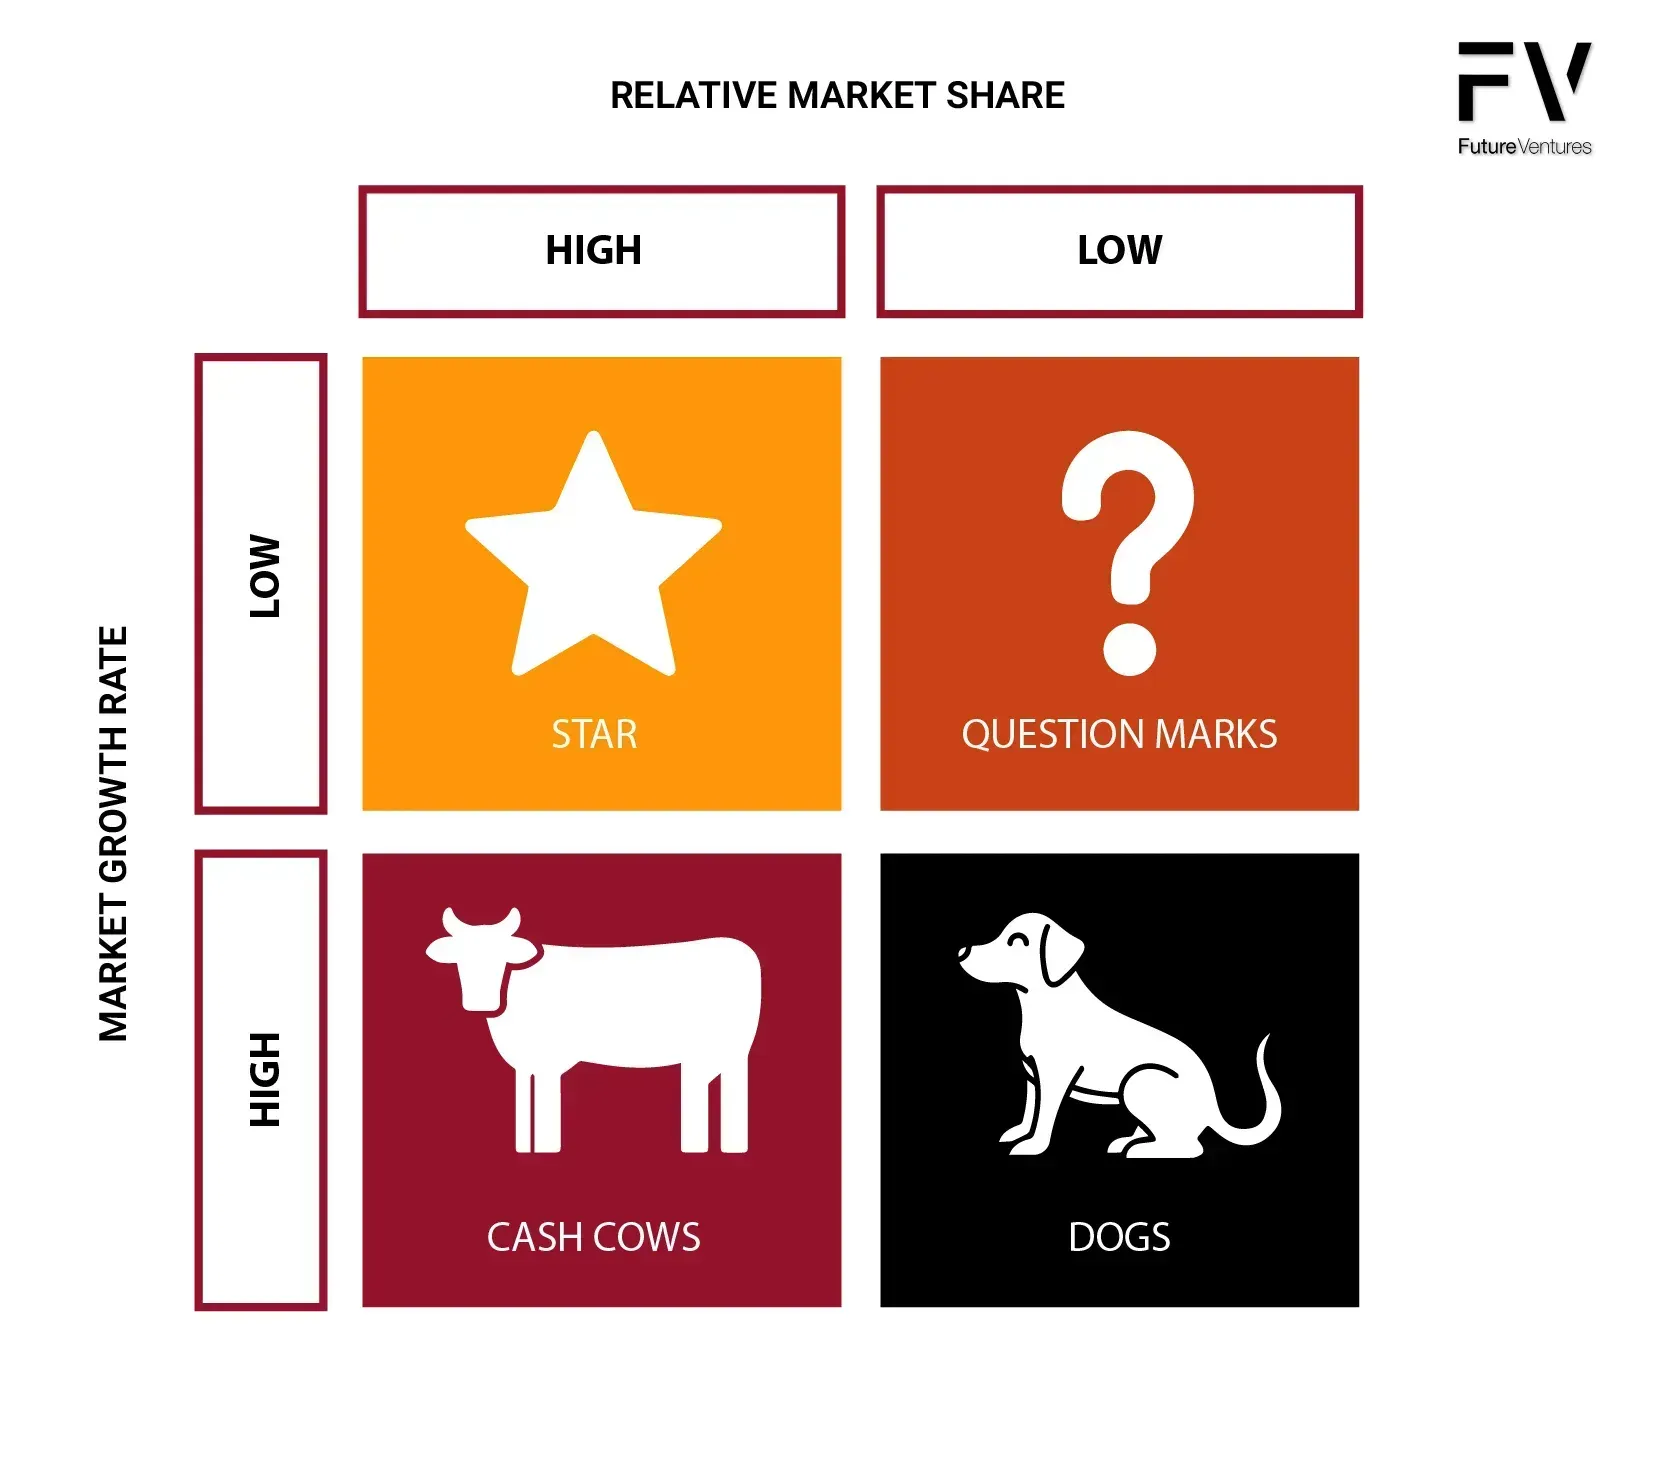
Axes you’ll actually use:
| Quadrant | What it is | Typical Cashflow | Your Default Move |
|---|---|---|---|
| Stars (High Growth, High Share) | Leaders in fast-growing markets | Cash hungry (growth soaks capital) | Invest to dominate, protect share, scale ops |
| Cash Cows (Low Growth, High Share) | Mature markets you dominate | Cash rich (high margins, steady) | Milk efficiently, defend profitability, fund the rest |
| Question Marks (High Growth, Low Share) | Attractive markets where you’re small | Cash hungry (uncertain path) | Place selective bets or kill fast - no “eternal maybe” |
| Dogs (Low Growth, Low Share) | Stagnant markets where you’re weak | Cash neutral/negative | Exit, harvest, or niche - do not feed |
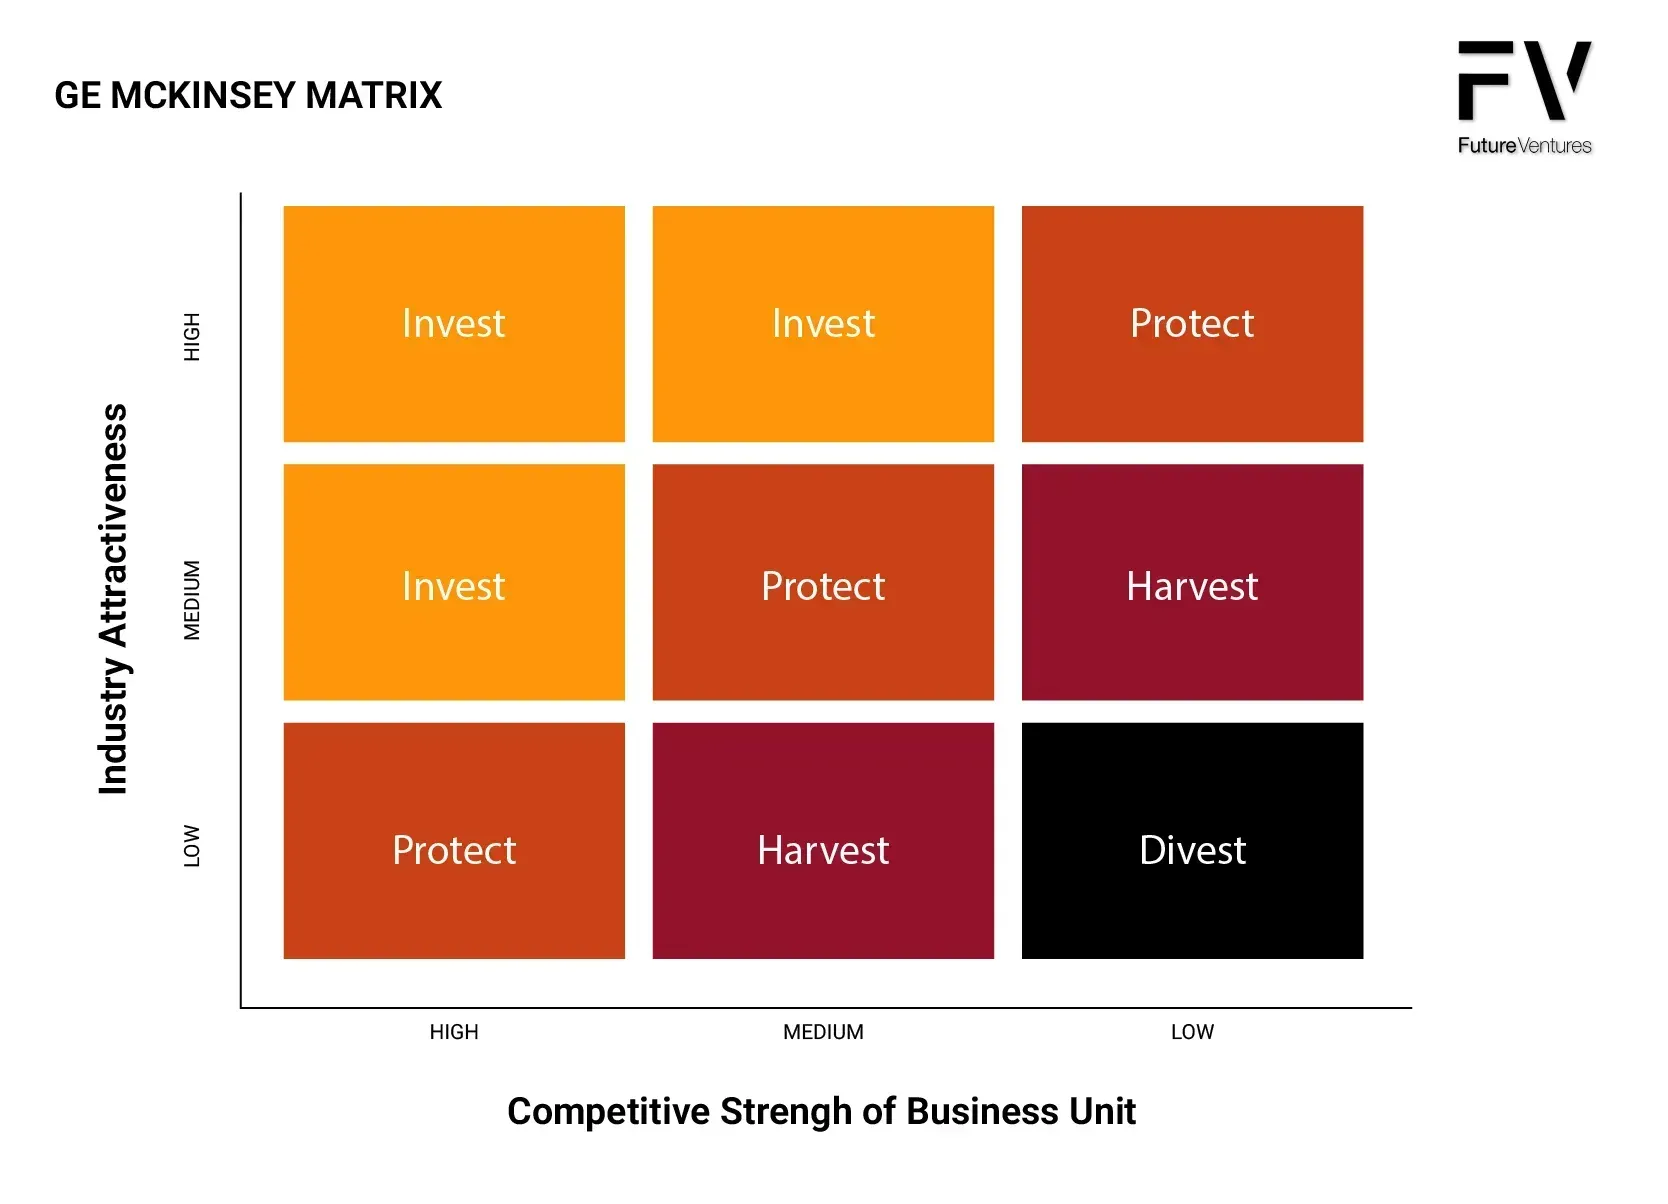
The GE-McKinsey Matrix (also called the Nine-Box Matrix or McKinsey-General Electric Matrix) is a strategic planning tool developed by McKinsey & Company for General Electric in the 1970s. It's a portfolio analysis framework used to evaluate business units and make investment decisions.
Structure: The matrix is a 3×3 grid with nine cells, plotting business units along two dimensions:
1.Industry Attractiveness includes:
2.Business Unit Strength includes:
The matrix enables managers to make more informed decisions about where to invest, maintain, or divest business units, taking into account both external market conditions and internal competitive capabilities.
| Dimension | Ansoff Matrix | BCG Growth–Share |
|---|---|---|
| Core question | How will we grow? | Where do we fund? |
| Unit of analysis | Company/product strategic move | Product line/business unit |
| Axes | Product (existing/new) × Market (existing/new) | Market growth × Relative market share |
| Output | Growth strategy portfolio | Capital allocation & lifecycle posture |
| Time horizon | 12–36 months (strategy & GTM) | 6–18 months (budget & ops) |
| Typical pitfalls | Over-diversifying, vague ICPs | Funding “dogs,” coddling “question marks” |
| Best together | Use Ansoff to choose plays, BCG to fund and sequence them |
👉 Takeaway: Ansoff is your “where to expand” compass. BCG is your “fuel the winners” wallet. Use both. One without the other is a plan without gas or a budget without a plan.
This is the “no-excuses” grid: products (rows) × segments/regions (columns) with a focus decision in each cell.
| Product / Segment | Core ICP | Enterprise | SMB | EU | APAC |
|---|---|---|---|---|---|
| Platform A | Invest | Hold | Harvest | Invest | Hold |
| Add-on B | Hold | Invest | Exit | Hold | Exit |
| Service C | Harvest | Harvest | Exit | Exit | Exit |
For each Invest cell, add:
👉 Takeaway: This matrix forces trade-offs. If everything is “Invest,” nothing is.
Market Penetration → Cash Cow upgrade
Product Development → Star creation
Market Development → bet the channel
Diversification → only with edge
Track these per product/market cell:
Decision Heuristics:
| Use Case | Ansoff | BCG | GE–McKinsey |
|---|---|---|---|
| Pick a growth move | ✅ | – | – |
| Allocate budget | – | ✅ | ✅ |
| Compare markets, by attractiveness | – | – | ✅ |
| Communicate portfolio to the Board | ✅ | ✅ | ✅ |
You don’t need all three every quarter. Most scale-ups win with Ansoff (choose plays) + BCG (fund plays), and pull GE–McKinsey only when you’re weighing many markets with complex, multi-factor attractiveness. The Matrix is often used in conjunction with other analysis frameworks, such as SWOT and PESTEL, to provide a comprehensive strategic view.
Governance that prevents drift:
| Existing Market | New Market | |
|---|---|---|
| Existing Product | Market Penetration: [tactics, KPI, owner] | Market Development: [geo/segment, localization, partner] |
| New Product | Product Development: [attach rate target, ARPU impact] | Diversification: [edge thesis, budget, kill-switch] |
| Product | Market | Growth (YoY) | RMS | Quadrant | Decision | Budget Δ | Owner |
|---|---|---|---|---|---|---|---|
| Platform A | Core SMB | 6% | 1.4 | Cash Cow | Harvest 10% OPEX | −10% | Ops |
| Add-on B | Data Services | 24% | 0.8 | Star | Invest in PLG + Sales | +25% | GM |
| Module C | Enterprise EU | 18% | 0.3 | Question Mark | 2 experiments, 2 quarters | +10% | VP EMEA |
| Legacy D | On-prem | 1% | 0.2 | Dog | Sunset in 9 months | −100% | CTO |
| Product / Segment | ICP Core | Enterprise | Mid-Market | SMB | Channel |
|---|---|---|---|---|---|
| Core Platform | Invest | Hold | Invest | Harvest | Hold |
| Analytics Add-on | Hold | Invest | Hold | Exit | Invest |
Horizontal diversification is a growth strategy that expands your company’s product or service offerings into new markets or customer segments while staying within your core industry. Think of it as broadening your product range to reach new customers, without straying too far from what you already know. Unlike vertical diversification, which takes you into entirely new industries or supply chains, horizontal diversification leverages your existing market knowledge, customer base, and operational strengths.
For example, a software company that sells project management tools to tech startups might launch a similar tool tailored for marketing agencies or HR teams. You’re not reinventing the wheel; you’re rolling it into new territory. The Ansoff Matrix emphasises horizontal diversification as a strategy to grow market share and reach new customer segments, while leveraging your existing expertise. Of course, every growth strategy comes with potential risks, so it’s critical to evaluate whether expanding your product range aligns with your business’s strengths and market realities.
Horizontal diversification is ideal when growth in existing markets slows or when you want to reduce dependence on a single product or customer segment. It’s effective for entering new regions or targeting similar market segments with related needs. Market research helps identify growth opportunities and validate demand. This strategy can boost market penetration, enhance customer loyalty, and open new revenue streams by leveraging existing products and market knowledge to serve adjacent segments.
Horizontal diversification can unlock major growth opportunities, but it’s not without its challenges. This strategy often requires a significant investment in marketing, sales, and product development to reach new customer segments and successfully expand your market share. One key risk is cannibalization. Your new offerings might eat into sales of your existing products. You’ll also face increased competition and may need to adjust your pricing strategies to appeal to different market segments.
On the flip side, the rewards can be substantial. When done right, horizontal diversification can accelerate market expansion, enhance profitability, and strengthen your competitive position. It’s a way to future-proof your business by spreading risk across a broader product market and meeting evolving customer needs. The product market expansion grid is a powerful tool for evaluating various growth strategies, enabling business leaders to weigh potential risks and rewards before committing resources. By aligning your diversification efforts with your company’s established strengths and the needs of new customer segments, you can maximize the upside while managing the downside.
What is the Product–Market Matrix?
It’s the Ansoff Matrix—a 2×2 matrix (existing vs. new products and existing vs. new markets) used to select market penetration, product development, market development, or diversification as your growth strategy. The product market matrix enables businesses to identify their target customers and align their strategies accordingly.
What is a Product Matrix?
A portfolio table showing your products/SKUs vs attributes/personas/tiers. It clarifies overlap, gaps, and monetization paths.
What is the Product–Market Focus Matrix?
An execution grid of products vs segments with a focus decision (Invest/Hold/Harvest/Exit) in each cell, including owner, KPIs, budget, and kill criteria.
What is a Market Matrix?
A table comparing markets/segments across attractiveness (size, growth, margin, regulation) and your position (share, edge). You can use a simple score or a nine-box (GE–McKinsey) to prioritize.
What is the BCG Product–Market Growth (Growth–Share) Matrix?
A 2×2 that classifies each product/business by Market Growth and Relative Market Share into Stars, Cash Cows, Question Marks, and Dogs to guide capital allocation:
How does BCG compare to Ansoff?
Ansoff tells you which growth move to pursue; BCG tells you how to fund your portfolio now. Use the Ansoff matrix to choose plays, and the BCG matrix to allocate cash and attention.
You don’t need another brainstorming session. You need a clear matrix of choices, money behind the right ones, and the courage to say no. That’s how you scale, on purpose.
Learn how seed strapping can fuel your startup's growth. Discover practical strategies and insights to navigate this crucial funding stage. Read more!
Learn how the Lehman scale sets M&A and capital-raising success fees: the Lehman formula, Double Lehman, modern variations and what founders should negotiate.
Explore the J Curve's implications for investors and strategists, balancing risks and rewards. Gain insights to enhance your decision-making—read more now!
Learn practical strategies to overcome common challenges as a first-time fund manager. Dive into our guide for essential tips and insights. Read more!
MIT found 95% of AI pilots fail. See how companies use AI to improve client workflows — and why integration decides the winners.
Discover how the CEO of the future is transforming business leadership and driving change. Read the article to learn more about this emerging role.
Quality of Earnings (QoE): understand what buyers and investors look for, uncover red flags, and boost valuation before your exit.
Maximize your productivity with our CEO time management template. Learn strategies to structure your day effectively. Read more for practical insights!
How founders use a 90-day execution sprint to turn strategy into results: set quarterly priorities, align the team and keep everyone accountable for progress.
Discover key insights on investor perceptions when founders become defensive. Learn tips to navigate tough conversations effectively. Read the article now!